Matrix and score comparisons
To follow this tutorial, download the FAN-C example data, for example through our Keeper library, and set up your Python session like this:
import fanc
import fanc.plotting as fancplot

import logging
logging.basicConfig(level=logging.INFO, format="%(asctime)s %(levelname)s %(message)s")

hic_esc = fanc.load("architecture/other-hic/bonev2017_esc_10kb.chr1.hic")
hic_cn = fanc.load("architecture/other-hic/bonev2017_cn_10kb.chr1.hic")

ins_esc = fanc.load("architecture/domains/bonev2017_esc_10kb.chr1.insulation")
ins_cn = fanc.load("architecture/domains/bonev2017_cn_10kb.chr1.insulation")

ins_esc_100kb = ins_esc.score_regions(100000)
ins_cn_100kb = ins_cn.score_regions(100000)
Also have a look at the command line documentation at Matrix and score comparisons for the command-line approach to comparisons in FAN-C.
Comparisons between datasets are important to identify and highlight differences. FAN-C has utilities to create comparison matrices and tracks by calculating their fold-change or difference.
Matrix comparisons
To compare matrices in FAN-C, you can use subclasses of
ComparisonMatrix. There are built-in classes for
fold-change matrices (FoldChangeMatrix) and
difference matrices (DifferenceMatrix), and their
usage is straightforward using the
from_matrices() function:
diff_esc_cn = fanc.DifferenceMatrix.from_matrices(hic_esc, hic_cn,
                                                  file_name="architecture/comparisons/esc_vs_cn.diff")
fc_esc_cn = fanc.FoldChangeMatrix.from_matrices(hic_esc, hic_cn, log_cmp=True,
                                                file_name="architecture/comparisons/esc_vs_cn.fc")
We enable log_cmp for the fold-change matrix, so comparison values are log2-transformed
and become symmetrical around 0.
Note that we could also have used scale=False in this case, to omit scaling to sequencing
depth, but if you are unsure whether your matrices are comparable without scaling it is
best to leave the setting at its default.
By default, infinite values resulting from a comparison (such as NaN from division by zero)
are omitted from the output matrix. You can keep them by disabling ignore_infinite.
If you want to omit comparisons among pixels that are 0 completely, use ignore_zeros.
We can show the result of the comparison using FAN-C plotting functions:
p_esc = fancplot.TriangularMatrixPlot(hic_esc, vmin=0, vmax=0.05,
                                      max_dist=400000)
p_cn = fancplot.TriangularMatrixPlot(hic_cn, vmin=0, vmax=0.05,
                                     max_dist=400000)
p_diff = fancplot.TriangularMatrixPlot(diff_esc_cn, vmin=-0.02, vmax=0.02,
                                       colormap='bwr', max_dist=400000)
p_fc = fancplot.TriangularMatrixPlot(fc_esc_cn, vmin=-1.5, vmax=1.5,
                                     colormap='PiYG', max_dist=400000)

gf = fancplot.GenomicFigure([p_esc, p_cn, p_diff, p_fc], ticks_last=True)
fig, axes = gf.plot("chr1:167.9mb-168.7mb")
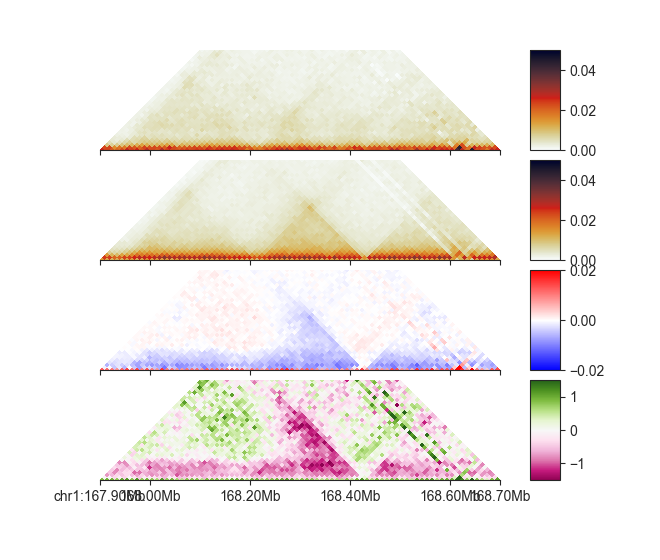
As you can see, each ComparisonMatrix acts just like
a regular matrix object.
Custom comparisons
If you require a custom comparison beyond the builtin difference and fold-change, you can
easily achieve that by subclassing ComparisonMatrix and
implementing a custom compare() function.
For example, if you want to create a comparison matrix where a pixels value is 1 if
the value in matrix 1 is larger than that in matrix 2, -1 if it is smaller, and 0 if
they are identical, you can use:
from fanc.architecture.comparisons import ComparisonMatrix


class CustomComparisonMatrix(ComparisonMatrix):
    _classid = 'CUSTOMCOMPARISONMATRIX'

    def __init__(self, *args, **kwargs):
        ComparisonMatrix.__init__(self, *args, **kwargs)

    def compare(self, weight1, weight2):
        if weight1 < weight2:
            return -1
        if weight1 > weight2:
            return 1
        return 0
Setting _classid enables loading by load().
Score / track comparisons
Although not necessarily Hi-C related in every case, FAN-C can also be used to compare any
kind of genomic track with scores associated with regions. File types like BED, GFF, BigWig
and many more (see RegionBased) can be loaded using load() and then
compared using from_regions(). FAN-C
has built-in classes for fold-change (FoldChangeRegions)
and difference (DifferenceRegions):
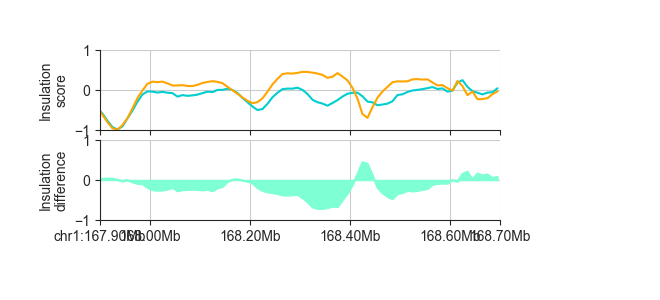
diff_ins_esc_cn_100kb = fanc.DifferenceRegions.from_regions(ins_esc_100kb, ins_cn_100kb)
We can plot it like any other region-based FAN-C object:
p_orig = fancplot.LinePlot([ins_esc_100kb, ins_cn_100kb], ylim=(-1, 1),
                           colors=['darkturquoise', 'orange'],
                           style='mid', fill=False)
p_diff = fancplot.LinePlot(diff_ins_esc_cn_100kb, ylim=(-1., 1.),
                           colors=['aquamarine'],
                           style='mid')
gf = fancplot.GenomicFigure([p_orig, p_diff], ticks_last=True)
fig, axes = gf.plot("chr1:167.9mb-168.7mb")

axes[0].set_ylabel("Insulation\nscore")
axes[1].set_ylabel("Insulation\ndifference")
This outputs a RegionsTable, but you can export to file using the
to_bed(), to_gff(), and
to_bigwig() functions.
Use log=True to log2-transform comparison values after the comparison, for example for
fold-change comparisons. You can change the attribute that is being compared using the
attribute parameter, which defaults to "score". Similarly, if you want the comparison
to be saved under a different attribute name, you can specify that using score_field.
Custom comparisons
For custom region-based comparisons, you can subclass
ComparisonRegions() and override
compare() in the same way you would with
ComparisonMatrix (see above).
Parameter-based score comparisons
In TADs and TAD boundaries we demonstrated how you can use
RegionScoreParameterTable objects to store parameter-based scores,
such as window sizes in InsulationScores. Such
RegionScoreParameterTable objects can also be compared
using FAN-C - in this case, a separate comparison is run for each parameter. The result is a
ComparisonScores object, which is based on
RegionScoreParameterTable and can be used as such. The
comparison is done with from_scores().
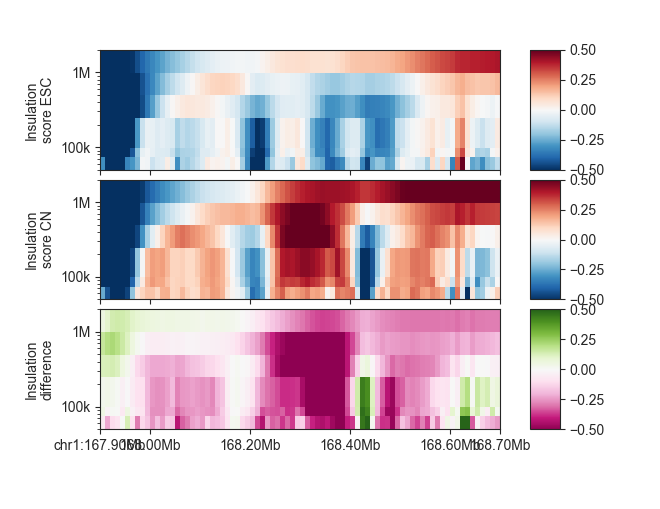
diff_ins_esc_cn = fanc.DifferenceScores.from_scores(ins_esc, ins_cn)
We can plot it like any other parameter-based FAN-C object:
p_esc = fancplot.GenomicVectorArrayPlot(ins_esc, colormap='RdBu_r',
                                        vmin=-0.5, vmax=0.5,
                                        genomic_format=True, y_scale='log')
p_cn = fancplot.GenomicVectorArrayPlot(ins_cn, colormap='RdBu_r',
                                       vmin=-0.5, vmax=0.5,
                                       genomic_format=True, y_scale='log')
p_diff = fancplot.GenomicVectorArrayPlot(diff_ins_esc_cn, colormap='PiYG',
                                         vmin=-0.5, vmax=0.5,
                                         genomic_format=True, y_scale='log')

gf = fancplot.GenomicFigure([p_esc, p_cn, p_diff], ticks_last=True)
fig, axes = gf.plot("chr1:167.9mb-168.7mb")

axes[0].set_ylabel("Insulation\nscore ESC")
axes[1].set_ylabel("Insulation\nscore CN")
axes[2].set_ylabel("Insulation\ndifference")